Immediate Fix: Optimize Health Check Annotations
To resolve slow load balancer health checks in Kubernetes, you must modify the service annotations to reduce the polling interval and failure threshold. By default, many cloud providers set conservative timers that can delay traffic routing by up to 30 seconds.
Apply these optimized annotations to your `Service` or `Ingress` manifest to speed up recovery and routing:
# Example for AWS Load Balancer Controller
apiVersion: v1
kind: Service
metadata:
  name: web-service
  annotations:
    service.beta.kubernetes.io/aws-load-balancer-healthcheck-interval: "5"
    service.beta.kubernetes.io/aws-load-balancer-healthcheck-timeout: "3"
    service.beta.kubernetes.io/aws-load-balancer-healthy-threshold: "2"
    service.beta.kubernetes.io/aws-load-balancer-unhealthy-threshold: "2"
spec:
  type: LoadBalancer
  ...
Reducing the `interval` to 5 seconds and the `healthy-threshold` to 2 ensures that your load balancer starts sending traffic to new pods within 10 seconds rather than the default 30-60 seconds.
Technical Explanation: The Propagation Lag
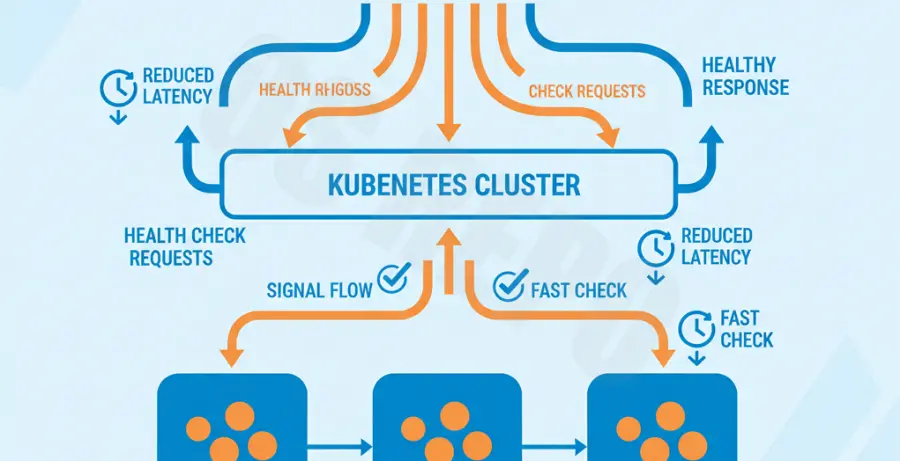
Slow health checks occur because of the multi-layered communication between the Cloud Load Balancer (ALB/NLB/GLB) and the Kubernetes nodes. The load balancer does not talk directly to your pods; it usually talks to the NodePort on the worker nodes.
If your health check interval is set to 30 seconds and the threshold is 3, a new pod must wait 90 seconds before receiving traffic. This “propagation lag” is compounded by the Kubelet’s own readiness probes.
| Parameter | Default Value (Avg) | Optimized Value | Impact |
|---|---|---|---|
| Interval | 30s | 5s-10s | Frequency of probes |
| Healthy Threshold | 3 | 2 | Successes needed to route |
| Timeout | 5s | 2s | Wait time before failure |
When a pod enters a `Running` state, the Kubelet must first pass its internal `readinessProbe`. Only then does the cloud load balancer start its own health check cycle. Aligning these two values is critical for performance.
Alternative Methods: Reducing Hop Latency
If adjusting annotations doesn’t fully resolve the slowness, the bottleneck may be internal network routing.
### 1. Use External Traffic Policy “Local”
By default, traffic hits any node and may hop to another node where the pod actually lives. This adds latency. Change your service configuration to:
spec:
  externalTrafficPolicy: Local
This forces the load balancer to only send traffic to nodes that are actually running the target pod, drastically reducing the health check complexity.
### 2. Configure Pod Readiness Gates
For high-traffic clusters, use **Pod Readiness Gates**. This feature ensures the load balancer health check is integrated directly into the Pod status. The Pod won’t be considered “Ready” until the load balancer confirms it is in the target group.
### 3. Tuning Application-Level Probes
Ensure your application’s `/health` endpoint is lightweight. If your health check endpoint queries a database or a heavy dependency, it will cause the load balancer to report “slow” or “unhealthy” status even if the network is fine. Use a dedicated, shallow endpoint for LB checks.