High memory usage on Kubernetes nodes is a critical issue that often leads to application instability. When a node runs out of RAM, the Kubelet triggers “Node Pressure” and begins evicting pods to save the system.
Understanding whether the issue stems from memory leaks, improper resource limits, or kernel-level overhead is the first step toward a stable cluster.
Symptoms & Diagnosis
The most common sign of memory issues is the OOMKilled status. This indicates that the Linux Out-Of-Memory killer terminated a process because the container exceeded its defined limit.
| Symptom | Diagnostic Signal | Impact |
|---|---|---|
| OOMKilled | Exit Code 137 | Pod restarts and data loss. |
| Node Pressure | MemoryPressure Condition | Node stops accepting new pods. |
| Throttling | High Latency / Slow Response | Degraded user experience. |
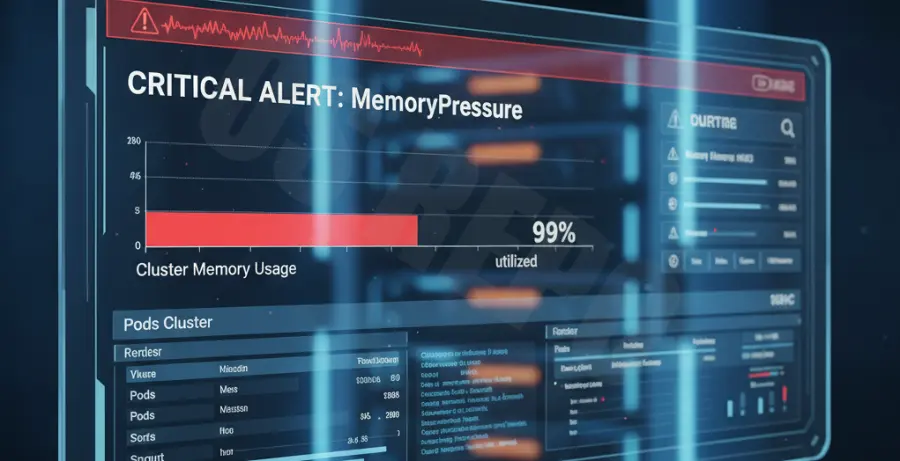
To confirm high memory usage, check the node status directly. Look for the “MemoryPressure” flag in the conditions section of the output.
Troubleshooting Guide
The first step in troubleshooting is identifying which pods are consuming the most resources. Use the Metrics Server to get real-time utilization data.
1. Identify Resource Hogs
Run the following command to see memory consumption across all nodes in your cluster.
kubectl top nodesOnce the problematic node is identified, list the pods on that specific node sorted by memory usage.
kubectl top pods -A --sort-by=memory2. Inspect Node Events
If a node is evicting pods, the events log will contain the specific reason. This helps distinguish between container-level limits and system-wide exhaustion.
kubectl describe node [node-name] | grep -i events -A 103. Check Container Logs
Check if the application is hitting its internal heap limit before the Kubernetes limit. This is common in Java (JVM) or Node.js environments.
kubectl logs [pod-name] --previousPrevention
- Set Resource Requests and Limits: Always define
requeststo ensure scheduling room andlimitsto prevent a single pod from crashing the whole node. - Implement Vertical Pod Autoscaler (VPA): Use VPA in “Recommendation” mode to analyze actual usage and adjust requirements automatically.
- Use LimitRanges: Enforce default memory limits at the namespace level to catch pods configured without resource constraints.
- Node Problem Detector: Deploy this tool to surface upstream kernel issues or hardware-related memory errors to the Kubernetes API.
- Monitor Memory Fragmentation: Sometimes nodes show free memory, but large contiguous blocks are unavailable. Regular node cycling can help.