Immediate Fix
If your Java 21 application is experiencing high CPU usage after enabling Generational ZGC, the fastest solution is to limit the concurrent garbage collection threads. By default, ZGC may use too many background resources for your specific hardware allocation.
# Reduce the number of concurrent GC threads
-XX:ConcGCThreads=2 -XX:ParallelGCThreads=4

# Alternatively, disable Generational mode to revert to standard ZGC
-XX:+UseZGC -XX:-ZGenerational
Lowering the thread count prevents the garbage collector from starving your application threads of CPU cycles during intense allocation periods.
Technical Explanation
Java 21 introduced Generational ZGC (JEP 439) to improve performance by separating the heap into young and old generations. This allows the JVM to collect short-lived objects more frequently with minimal overhead.
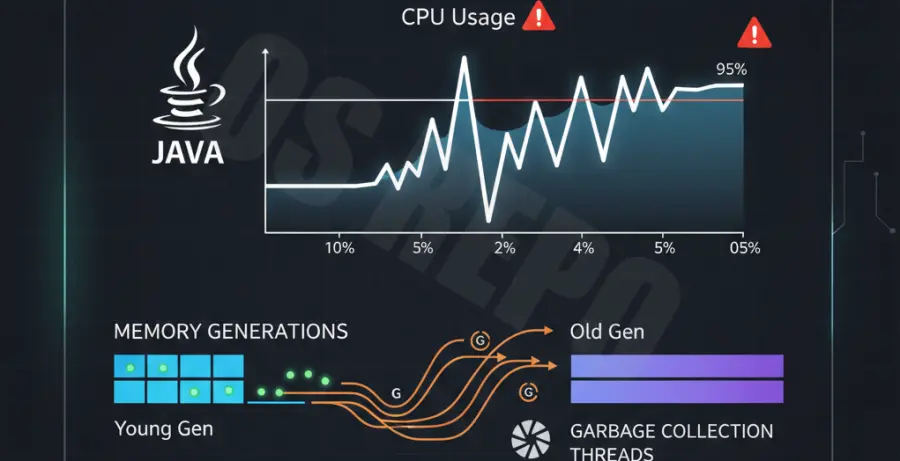
High CPU usage usually stems from “allocation stalls” or aggressive background scanning. When the application’s allocation rate is extremely high, the GC threads must run constantly to clear space in the young generation.
Because Generational ZGC is designed to be highly concurrent, it utilizes multiple CPU cores to perform marking and relocation. On systems with limited CPU resources, this background work competes directly with the application’s throughput.
Alternative Methods
Adjusting Allocation Spike Tolerance
You can fine-tune how ZGC reacts to sudden increases in memory allocation. Increasing the tolerance can sometimes stabilize CPU usage by making the GC more proactive without being overly aggressive.
| JVM Flag | Purpose |
|---|---|
| -XX:ZAllocationSpikeTolerance=5.0 | Higher values make the GC start earlier to prevent OOM, smoothing out CPU spikes. |
| -Xmx | Increasing the total heap size reduces the overall frequency of GC cycles. |
| -XX:SoftMaxHeapSize | Allows ZGC to use more memory temporarily before aggressive reclaiming begins. |
Monitoring with JFR
If the CPU remains high, use the Java Flight Recorder (JFR) to identify if the threads are stuck in “Relocation” phases. This data helps determine if the issue is memory fragmentation rather than raw allocation speed.
# Enable JFR to monitor GC behavior
-XX:StartFlightRecording=filename=recording.jfr,settings=profile
If tuning ZGC does not lower CPU usage to acceptable levels, consider switching back to G1GC, which is often more predictable on smaller heap sizes or limited CPU environments.